|

Abstract
Table
of Contents
Part I

Part II

Part III

Part IV

Appendixes
|
Part I: The Intrusion of Death
Chapter 5
Longevity In Genesis
All the days of Methuselah
were
nine hundred and sixty nine years.
(Genesis 5:27)
The days of our years
are
threescore and ten;
if by reason of strength they be
fourscore years,
yet is their strength labour and sorrow;
for it is soon cut off,
and we fly away.
(Psalm 90:10)
The biblical
record has presented a problem for chronologists, which involves
a paradox. The total period covered by the patriarchal list from
Adam to Noah is far too short to satisfy the demands of
current chronology which claims up to two million years for the
time of the appearance of the first man; but the ages which are
given are far too long! In one respect, therefore, the
record is much too circumscribed, and in another respect much
too extended. The usual method of dealing with this paradox is
to say that the figures really have no meaning. This is myth,
not history.
In order to extend the total interval
from the creation to the Flood without dispensing with the record,
it is sometimes pointed out that the Septuagint versions give
a longer period by approximately one third as shown in the table
below, although this helps very little since it provides us with
only an extra 600 years or so. Two other chronologies
 pg.1
of 21 pg.1
of 21 
for the period in question
which might help are to be found in Josephus and in the Samaritan
Pentateuch, also shown in the table. Unfortunately, Josephus
essentially copies the Septuagint, while the Samaritan Pentateuch
succeeds only in reducing the total by 350 years.
In the table which follows, figures
are given for the ages of the fathers at the time of their firstborn
according to the Hebrew text, the Alexandrian Septuagint,
the Vatican Septuagint, Josephus, and the Samaritan Pentateuch.
By adding these ages together, along with the age of Noah at
the time of the Flood, it is possible to calculate the total
time which elapsed from the creation of Adam to that event.
GIVEN AGES OF FATHERS AT BIRTH OF FIRSTBORN
| |
Heb. |
Alex. LXX |
Vat. LXX |
Josephus |
Sam. P. |
| 1. Adam |
130 |
230 |
230 |
230 |
130 |
| 2. Seth |
105 |
205 |
205 |
205 |
105 |
| 3. Enosh |
90 |
190 |
190 |
190 |
90 |
| 4. Kenan |
70 |
170 |
170 |
170 |
70 |
| 5. Mahalalel |
65 |
165 |
165 |
165 |
65 |
| 6. Jared |
162 |
162 |
162 |
162 |
62 |
| 7. Enoch |
65 |
165 |
165 |
165 |
65 |
| 8. Methuselah |
187 |
187 |
167 |
187 |
67 |
| 9. Lamech |
182 |
188 |
188 |
182 |
53 |
| 10. Noah |
600 |
600 |
600 |
600 |
600 |
|
Totals |
1656 |
2262 |
2242 |
2256 |
1307 |
Now the question
of which text is to be regarded as the original one was nicely
summed up many years ago by Dr. James C. Murphy who showed that
the internal evidence from the figures themselves is decidedly
in favour of the Hebrew text. *
The numbers in the Septuagint
(LXX) evidently follow a plan to which they have been conformed.
This does not appear in the Hebrew, and it is greatly in favour
of its being an authentic
* Murphy, James
C., Commentary on Genesis, Belfast, no date, p.196.
pg
2 of 21
genealogical record. The numbers before
the birth of a successor, which are chiefly important for the
chronology, are enlarged in the LXX, by the addition of just
one hundred years in each of six cases, making Adam 230 years
old at the birth of Seth, Seth 205 years old at the birth of
Enosh, and so on, while the sum total of each life remains the
same as in the Hebrew, with a slight exception of 25 years in
the case of Lamech. The object here is evidently to extend the
total life span of each individual.
It is not easy to imagine
what motive could have led in the other direction, i.e., to the
shortening, if the original had been as given in the Septuagint;
since all ancient nations have rather shown a disposition to
lengthening their chronologies. On physiological grounds, too,
the Hebrew is to be preferred, since the length of the life does
not at all require so late a manhood as those numbers would seem
to intimate.
We shall have
occasion to examine this evidence of internal proportional consistency
in a way that was not available to Murphy but fully bears out
his contention.
There is a further consideration
also which we may touch upon here in the analysis of the figures.
It is found that between the period of childlessness and the
total length of life in the Hebrew text, there is a high
correlation, but by an exactly comparable method of statistical
analysis the correlation in the Septuagint and in the text given
by Josephus is very low indeed. The Samaritan Pentateuch does
a little better than the two latter versions, but it has a peculiar
artificiality about it in that the numbers are arranged in a
more or less steadily declining order, which is cause for suspicion
when it is realized that the total life spans of these same individuals
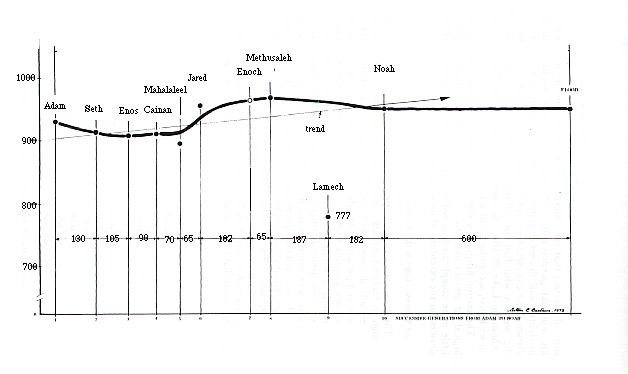
show no such steady decline. In actual fact, Methuselah who lived
longer than any of the others, comes late in the list (eighth),
while Jared (the sixth) and Noah (the tenth) both lived longer
than Adam. This fact is visually apparent in the graph shown
in Fig.1.
It is important to notice, therefore,
that this decline in the period of childlessness which makes
the Samaritan figures look more "realistic" in one
way, is badly upset when the figures for total life span are
correlated with them. All in all, there is every reason to have
far more confidence in the Hebrew version than in any of the
others: and since the others do not really help to solve any
chronological problems, there are really no good reasons for
preferring them.
Before proceeding to an analysis
of the figures in the Hebrew text, it may be useful to consider
very briefly two suggestions which have been made for the extension
of the time interval of 1656 years between Adam and the Flood.
The first proposal is that we do not have a complete and continuous
genealogy from Adam to Noah, in
pg.3
of 21
pg.4
of 21
spite of the fact that
each successor is stated to have been the son of his immediate
predecessor. The argument here is that the word son in
Hebrew can also mean grandson or great-grandson, to any degree
of distance one chooses, even as Christ is spoken of as a son
of David, or the woman who had an infirmity is spoken of as a
daughter of Abraham (Luke 13:16). So there may well be gaps in
the record for all we know � according to the critics.
The second proposal is that the
names of individuals in the genealogical list are not individuals
at all, but dynasties. This concept is a little more complicated,
as will be seen. Let us consider these two devices for the extending
of the chronology.
1. The Supposed Gaps in the Record.
The proposal
that there may be gaps in the record is reasonable enough in
certain contexts, for Scripture shows many such gaps, but they
are only discoverable by reference to parallel portions of Scripture
where comparison of the details shows them up at once. Did we
have but one account without any means of comparison with a parallel
account, it would not be possible to discover that names were
omitted. Sometimes a father is said to have borne a certain individual
as his son, whereas we learn from other parts of Scripture that
the individual was actually his great-great-grandson. The fact
is well known to biblical chronologists. Such "incomplete"
genealogies are not infrequent. Two are illustrated below in
the following tables. In the table immediately below will be
seen, in parallel columns, the genealogy given in 1 Chronicles
6:6-10 and Ezra 7:3-4 for Zerahiah to Amariah, in which it will
be noted that in the second instance six names are omitted.
| 1 Chronicles 6:6-11 |
Ezra 7:3-4 |
| Zerahiah |
Zerahiah |
| Meraioth |
Meraioth |
| Amariah |
- |
| Ahitub |
- |
| Zadok |
- |
| Ahimaaz |
- |
| Azariah |
- |
| Johanan |
- |
| Azariah |
Azariah |
| Amariah |
Amariah |
Note: Ezra 7:3 lists the names in column 2
in reverse order.
pg.5
of 21
Obviously
in this passage the word son has a much broader
meaning than it does in English when applied to the relationship
between Azariah and Meraioth who preceded him by seven generations.
It will be noted also, in this case, that the earlier table is
the complete one.
By contrast, in the following table,
we have two genealogies which are parallel only in the sense
that they cover the same period of time, though not the same
list of individuals.
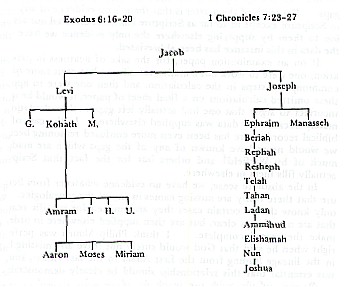
In this
case, beginning with Jacob we have two contemporaries, Levi and
Joseph in the next generation, and then in Exodus 6:16-20 we
have what appear to be only three generations till the introduction
of Aaron, Moses and Miriam. Now Aaron, Moses and Miriam were
contemporaries of Nun the father of Joshua, but between Joseph
and Nun there intervened nine generations whereas between Levi
and Moses are shown only two generations. This will be clear
enough by examining Table VI. But if we did not have the right
hand column of this Table, then from Exodus 6:16-20 we might
very well suppose that Aaron and Moses were only the third
generation from Levi. If we allow thirty years for a generation,
this would represent a time
pg.6
of 21
interval of about a hundred
years. But the parallel genealogy shows us that this would be
a misrepresentation of the facts since there are nine
generations in the interval which actually spanned approximately
three hundred years.
A great deal has been made of such
gaps in Scripture by those who would like to extend its chronology
substantially. I have dealt with these incomplete genealogies
in some depth in another volume. *
Here it is
shown that it is not proper to assume, on the basis of these
known gaps, that there may on that account be many other
gaps which leave biblical chronology open-ended, since we
have no proof of any such gaps. The truth of the matter is that
there is no evidence of any gaps in Scripture except in so far
as Scripture has itself directed our attention to them by supplying
elsewhere the only evidence we have that the data in this instance
has been abbreviated.
If on an examination paper, for
the sake of neatness in presentation, one were to work out a
mathematical sum but omit some of the commonplace steps in the
calculation, and then one were to append these omitted calculations
on a final sheet of paper, it would be quite incorrect to argue
that one had actually left gaps in the calculation _ merely because
the data was supplied elsewhere. In the case of the biblical
record, there has been even more confused reasoning because we
would never have known of any of the gaps which are made
so much of by Warfield† and others but for the fact that Scripture actually
fills them in elsewhere.
In the absolute sense, we have
no evidence whatever from Scripture that there really are missing
names in any of the genealogies. We only know that in certain
cases they are omitted for specific reasons that are not always
clear, but are then supplied elsewhere in order to make the record
complete. I think Philip Mauro was perfectly right when he said
that God would surely not leave any missing links in the lineage
leading from the first Adam to the last Adam, since it was essential
that this relationship should be clearly demonstrable.‡
Because of the wide use made by
those who appeal to these supposed gaps in order to bring the
Word of God into line with current evolutionary doctrine, it
is very important to observe that there is no evidence whatever
of such gaps in Scripture unless one
* Custance, Arthur C., "Genealogies of the Bible"
Part V in Hidden
Things of God's Revelation, vol.7 of The Doorway Paper Series,
Zondervan, 1977.
† Warfield, Benjamin B., "On
the Antiquity and the Unity of the Human Race," Biblical
and Theological Studies, Philadelphia, Presbyterian and Reformed
Publishing Co., 1968, p.238 ff.
‡ Mauro, Philip, The Chronology
of the Bible, Boston, Hamilton Brothers, 1922, p.10.
pg.7
of 21
adopts a policy of arguing
from part of the record only. The record as a whole does not
leave any gaps. The claim that such gaps exist is an argument
based entirely on a selective reading of Scripture, while ignoring
the rest of the evidence.
2. Names Refer to dynasties, Not to Indviduals
We come, then,
to the second alternative, namely, that we are really dealing
with dynasties rather than individuals, a proposal which is believed
to overcome two difficulties at once. In the first place, the
great periods attributed to each entry are not the life spans
of individuals but periods during which a tribe or a dynasty
founded by that individual, was in the ascendancy. In the second
place, it is proposed that the time periods ascribed to individuals
who were contemporaries for a large portion of their lives, are
really consecutive and therefore may be added together as reigns
are added together, thus considerably extending the time period
from Adam to the Flood. In Appendix 5 will be found a Table showing
how this scheme is applied to Genesis 5. At this juncture it
is only necessary to say that the total time span can be extended
to a period of 7630 years from the birth of Seth to the Flood,
by comparison with the biblical chronology of about 1656 years.
From the point of view of evolutionary anthropology, this is
inconsequential.
I fancy this method of interpreting
the genealogy originated with one who was acquainted with modern
Arabian genealogies and family histories in which the whole clan
may be treated as a single individual. It is sometimes pointed
out that in Acts 7:16 the name Abraham refers to the clan
or family of Abraham, the patriarch himself being dead at the
time of the transaction referred to.
However, there is no doubt that
some of the names at least are clearly intended to refer to individuals
whose personal history is really the interest of the writer
� Enoch, for example, whose 365 years of life clearly refer
to the time he spent on earth before his translation and surely
cannot be applied to the time period in which his clan was in
the ascendance. Noah who comes last in the list, is surely the
same individual who, 600 years later, survived the Deluge with
his immediate family, and the vignette of his life which follows
the story of the Flood is obviously intended to be taken as personal
history. Altogether, it seems unlikely that anything is gained
by re-interpreting the record as a list of dynasties.
The Genesis record contains the
same kind of information after the Flood, giving us the
age of the father at the birth of his son and in the end his
total life span. But in this instance no commentator has suggested
that the figures should be interpreted as a succession of dynasties.
pg.8
of 21
The
post-Flood data show, moreover, that there is a steady decline
in life span so that if a graph is constructed (see Fig. 3) the
curve has the appearance of representing a genuine biological
phenomenon of declining viability until the age of man has fallen
below 120 years. It is as though the data were intended to show
how the longevity of antiquity gradually decayed until man reached
his present life span. Thenceforth the subject was not worthy
of further consideration in Scripture, and from this point on
we are only once told what a man's age was when he died! We shall
have occasion later to examine the probable reason why this is
so.
Altogether, I think it makes much
more sense to take these lists of Genesis and treat them both
statistically and graphically as though they are records of the
lives of individuals. The result of such an analysis is quite
surprising for it is apparent that the figures display just that
measure of variance, along with an over-all consistency, such
as are normally observed in genuine vital statistics. But this
normalcy is observed only if we go by the figures in the Hebrew
text and not by those in any of the other texts such as the Septuagint
for example. In the latter, as we have seen, there is a certain
artificiality, a kind of deliberate evening out of the figures,
as though the editor was attempting to give them a degree of
uniformity which he felt was missing. But his emendations were
not consistent nor were they effected right across the board,
and the result is that statistical analysis of certain correlations
clearly reveals that the data themselves have been inexpertly
tampered with.
Now, in applying standard techniques
of statistical analysis to the data provided in Genesis 5 on
the ten pre-Flood patriarchs, it is necessary to exclude certain
of the names as being too exceptional. We must exclude Enoch
since we do not have any figures which would have represented
his natural life span, because he was removed prematurely. Lamech
also appears to be an exception. This is clear from Fig.1 where
his name completely departs from the comparatively smooth curve
drawn through the rest of the entries. Evidently he died "young";
but also he appears to have matured slowly, for his period of
childlessness was significantly greater than for any of the others.
Curiously enough, Lamech seems to have felt the burden of living
more than the others, since he alone appears to have complained
(Genesis 5:29). Perhaps he was frustrated by the fact that his
old father, Methuselah, living on and on, delayed his own accession
to a position of seniority in the family. At any rate, if his
name is included in the list for the purposes of statistical
analysis, the effect is a total distortion of relationship between
the period to the begetting of the first son
pg.9
of 21
and the total life span.
Finally, we must also exclude Noah, since he closed his life
under different conditions in the world after the Flood and since
there is some uncertainty as to the precise meaning of Genesis
5:32 where we are told that he was 500 years old when he bore
all three of his famous sons � Shem, Ham, and Japheth.
Not only is this very late in life to beget a firstborn compared
with the other patriarchs, but clearly there is some special
circumstance involved unless these three sons were triplets.
Had they been so, we might expect to have been informed of the
fact, as we are of Jacob and Esau. The use of the term younger
when applied in Genesis 9:24 to Ham does not altogether rule
this out because even if all three were born together, the first
one to appear would be marked as the oldest and the last one
as the youngest.
This seems a drastic reduction
of the list, from ten names to seven. But it happens that, in
statistics, seven is still accepted as a sufficient number of
entries under certain circumstances. Anything less renders the
correlation formula which I propose to use unacceptable.
Using the Spearman Rank Order Formula,
a very high correlation indeed is found between the figures given
for the period of childlessness and the total life span of each
individual as recorded in the Hebrew text, but when the figures
given for the same individuals as found in the Alexandrine Septuagint
and the Vatican Septuagint (Table IV) are treated in the same
way, the result is entirely different.
The Spearman Rank Order Correlation
Formula is:
The method
of using this formula is straightforward. The names are listed
as they appear in the table below in Column 1. This is followed
in Column 2 by the life spans. Column 3 is the Rank Order, i.e.,
the largest life span is No. 1, the smallest becomes No. 7, and
each life span is given a serial number representing its order
in rank. In Column 4 the period of childlessness is listed. These
figures are once more ranked as shown in Column 5.
Column 6, marked "Difference"
(D), represented the difference between the figures in Column
3 and 5, i.e., the disparity between the relative rank orders.
The positive or negative sign is ignored because in Column 7,
which is marked D2,
the process of squaring the figures cancels out the negative
sign in any case. The last column is then totalled to give the
value as shown. In the formula, n is simply the number
of entries � in this case 7.
pg.10
of 21
| Col. l |
Col. 2 |
Col. 3 |
Col. 4 |
Col. 5 |
Col. 6 |
Col. 7 |
| Name |
Life Span |
Rank
Order |
Childless
Period |
Rank
Order |
Diff'ce |
D2 |
| Adam |
930 |
3 |
130 |
3 |
0 |
0 |
| Seth |
912 |
4 |
105 |
4 |
0 |
0 |
| Enos |
905 |
6 |
90 |
5 |
1 |
1 |
| Cainan |
910 |
5 |
70 |
6 |
1 |
1 |
| Mahalaleel |
895 |
7 |
65 |
7 |
0 |
0 |
| Jared |
962 |
2 |
162 |
2 |
0 |
0 |
| Methuselah |
969 |
1 |
187 |
1 |
0 |
0 |
| |
|
|
|
|
sum = |
2 |
| Applying
the formula: |
|
| We have: |
 |
|
 |
Now a word about
the formula and the value of r (0.96). After years of analyzing
data in a laboratory where the number of entries sometimes ran
into three or four hundred and not merely seven as we have here,
we took the trouble on a number of occasions to apply the Spearman
Rank Order Formula as well as the usual far more complex formula
which involves such high numbers that a calculator is necessary.
We consistently found that the difference in the correlation
values by the two methods was usually only in the second decimal
point. Simple as it is, Spearman's Formula is, therefore, remarkably
useful.
The value of r as found
above has the following significance. Any group of figures such
as these, because they are derived from vital statistics, are
likely to fluctuate entirely due to chance in a way that
pg.11
of 21
there will almost never
be a perfect correlation. There will always be some individuals
who mature more quickly than others for no evident reason, and
some individuals who die much younger or much later than their
peers � again, for no self-evident reason. Where there are
evident reasons, one normally excludes their statistics from
the calculations (as we have done with Lamech). If the basic
concept that there is a firm relationship between the rate of
maturing and the length of life is sound, the longer a person
has lived the more likely it will be that he has matured more
slowly. Thus as the life span increases one expects, other things
being equal, that the time to the appearance of the first child
will be correspondingly greater. If this always happened, we
would have a perfect correlation and the value in the Spearman
Formula would then work out exactly at 1.00. If the figure works
out to be very much less than 1.00 (say, 0.25), then the correlation
is poor. It may even be reversed, the oldest persons consistently
bearing their children at the youngest period of their lives,
in which case the value of r is negative.
In the analysis of the Hebrew text
it will be seen that the correlation is remarkably high (very
nearly 1.00) and although such statistical analysis is really
only a measure of probability, it does imply that the figures
in Genesis 5 are genuine, undoctored by any scribe or editor:
OR they have been exceedingly carefully edited by someone thousands
of years ago who was aware of the kind of analysis they might
be subjected to much later in history. This alternative can be
discounted.
The significance of the high correlation
based on the figures given in the text of Genesis becomes more
apparent when we apply the same technique of analysis to the
figures in the Alexandrine Septuagint which some authorities
have preferred. These values for r are shown below.
| Hebrew Text |
Alexandrine Septuagint |
Vatican Septuagint |
| 0.96 |
0.07 |
Minus 0.07 |
Assuming,
then, that the figures in Genesis according to the Hebrew text
are the correct ones, we can construct a graph (Fig.1) showing
that the viability of man from Adam to Noah has a rather surprising
trend upwards. One could speculate that, immediately after the
Fall, man's ability to compensate for his now lessened vitality
in extracting a living from the soil, was improved with time
pg.12
of 21
and the ingenuity by
those of later generations who developed a high technology with
remarkable speed, as Genesis 4:17-22 indicates. Moreover, the
smallness of the population at first would also contribute to
the difficulties of achieving dominion over the earth. But the
very long lives of the earliest people would accelerate the accumulation
of knowledge and experience so that civilization would all the
sooner be advanced to the point where labour-saving devices and
measures taken for the preservation of life and the curing of
disease would gradually increase security and lead to a less
exhausting way of life. There may in that case have been a slight
amelioration of the effects of the Fall on man's physical well-being
which would be reflected by some gains in terms of life span,
although the same advantages would undoubtedly tend to increase
man's potential for wickedness, so that by the time of Noah technology
was advanced enough not only to allow the building of a giant
ship as large as the Great Eastern of comparatively modern times,
but a spiritual condition so serious as to demand the almost
total destruction of the human race.
Whether the Flood which was brought
upon the world in judgment was geographically universal,
or whether the world's population was still concentrated in a
comparatively small area so that the Flood needed only to overwhelm
that area, is a point of considerable argument. In the present
context, the really important point is that the race of mankind
was literally reduced to eight sole survivors, Noah and his three
sons and their four womenfolk. The consequences of this in terms
of the future life span of man were very great indeed � and
for perfectly understandable reasons.
Post-Flood Decline in Longevity
Immediately
after the Flood the course of events in terms of human life span
clearly changed very dramatically, as will be seen in Fig.2.
Something quite specific reduced man's life expectancy from nearly
a thousand years to 120 years within a period of seventeen generations.
When the data provided in Scripture are plotted in the form of
a graph and these points are converted into a smooth curve, the
end result is a graph which has such a normal appearance about
it that no one who is accustomed to viewing scattergrams of biological
data would doubt for one moment the validity of it � especially
if they were not aware that it is based on biblical data. It
is a perfect example of what happens when some biological trend
is explored and plotted routinely, provided that the original
data have not been manipulated or gathered without sufficient
precautions. Speaking personally, having drawn hundreds of scattergrams
of this nature from data derived from our own experiments using
human subjects over a period of fifteen years
pg.13
of 21
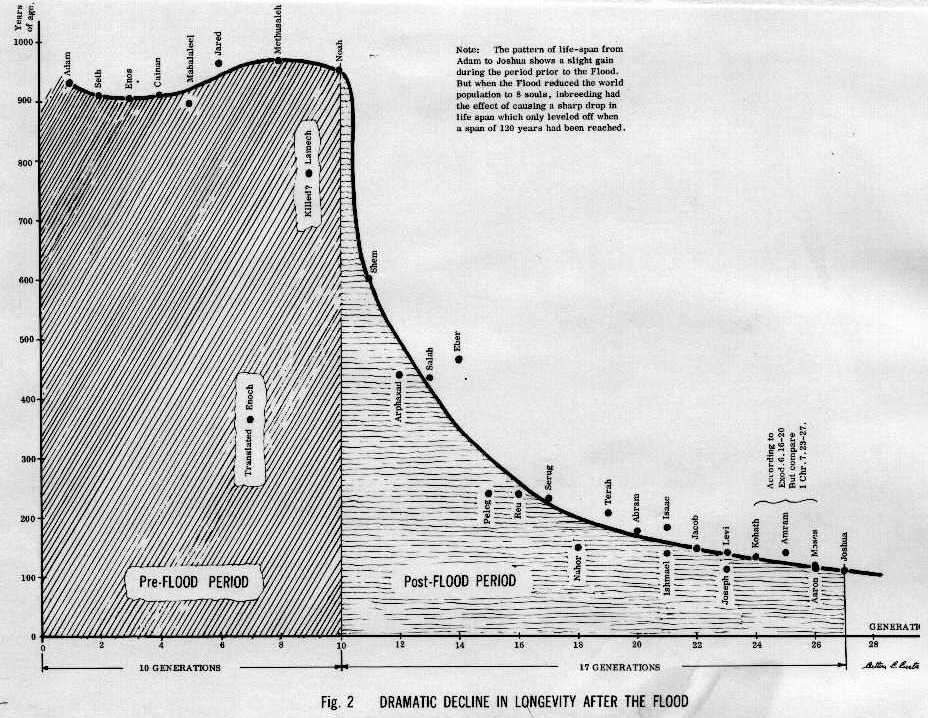
Figure 2. Dramatic Decline in Longevity After the
Flood.
Vertical axis, ages in 100-year increments.
Horizontal axis, number of generations after Adam.
pg.14
of 21
or so, there is not
the slightest doubt in my mind that the relevant data provided
for us in the Bible are genuine. There is just that measure of
inconsistency and variance between individual readings, combined
with a certain over-all smoothness of trend which is so characteristic
of experimental data where living things are concerned that we
can have strong confidence in the genuineness of the original
figures.
But more than this: the decline
continued for a long time, far beyond the period covered by Fig.2,
until a kind of equilibrium was achieved with a normal life span
of about three score years and ten. What was the factor that
caused the initial dramatic decline in life span from Noah's
950 years to Moses' and Aaron's 120 years, within sixteen generations?
It has been suggested � and
it may very well be true � that a rather radical change took
place in atmospheric conditions in connection with the Flood
itself. There are those who believe that prior to the Flood,
man was shielded from harmful cosmic radiation and even possibly
from direct sunlight, by some kind of canopy of water vapour
which was more than merely an unusually heavy cloud cover. It
is thus held that the collapse of this canopy contributed to
the extraordinarily heavy rains which were partial cause of the
Flood itself. The appearance of the rainbow as a special sign
of assurance that such an event would not occur again on the
same scale may be an indication that the conditions of ordinary
rainfall as we now experience it, did not apply in pre-Flood
times. It is held that actual rain was not experienced before
the Flood. The earth was watered through the agency of a kind
of water-saturated environment, rather like a hothouse situation.
It may be. On the other hand, the sun and the moon (and the stars?)
must surely have been visible, in view of the fact that they
were given for signs. We are not told in Genesis 1:14-16 that
the stars were given for signs, only that the sun and
moon were. *
But it seems
to me to be implied that the stars were visible also; though
it is difficult to see how even the existence of stars which
would not actually be visible through such a canopy could be
known to the earth's inhabitants.
It is certain that cosmic radiation
and certain forms of solar radiation do have an effect upon life
span. (111) If
there was a change from a wholly shielded environment in this
respect to one in which, after the Flood, shielding was greatly
reduced, then it might be
* The Hebrew 'oth rendered signs,
is generally considered to mean something more than markers,
they would surely have to be rather clearly visible as
distinct objects. Would it fulfill the conditions of their appointment
that they only distinguished night from day?
111. Cassaret, George W., "Acceleration of Aging by Ionizing
Radiation", University of Rochester Atomic Energy Project,
University Report #492, New York, 1957; Howard J. Curtis, "Biological
Mechanisms Underlying the Aging Process", Science,
vol.141, 1963, p.698-691; and "Effects of Radiation on Human
Heredity", WHO (World Health Organization), Geneva,
1959.
pg.15
of 21
expected that the life-shortening
consequences of exposure to such radiation would become immediately
apparent. This could account for the sudden decline in life span
shown so dramatically in Fig.2.
However, there is another factor
which I believe was a more potent one, that is only shown up
by examining the nature of this curve more closely. Figure 3
displays the details of this period of human history on an enlarged
scale to bring out two aspects of this sudden decline, one of
which is related to the genetics of inbreeding.
When Adam and Eve were created,
they were perfect, not only spiritually but physically
also. None of their genes were defective by reason of mutation.
What are known as mutations are errors of transcription in the
basic coding of the DNA in the individual cell nuclei which appear
to occur sometimes spontaneously when the cells multiply or which
are caused by external agencies such as radiation and certain
poisons, like mustard gas for example. Once such an error has
occurred, the line of cells derived from the damaged original
will all carry the same error or fault. Some of these faults
appear to be comparatively harmless, although most authorities
believe that all mutations are harmful. Certainly, all
mutations can be harmful under certain conditions. These faults
in replication, which are called mutations, are found to occur
at specific locations on the chromosomes which determine the
character of each cell. These locations are called genes. In
man it is believed that there are possibly 40,000 such genes
altogether in every cell. There is room, therefore, for a significant
number of errors or mutations in any one cell: and it should
be remembered that all the cells descended from a damaged cell
will normally bear the same defect.
Now the only mutations that occur
during the life time of an individual which can injure the next
generation are those which have occurred in the ova or the spermatozoa,
since these alone form part of the body of the next generation.
Any agency which damages these reproductive cells has grave consequences
for the future of the line thus affected. This is particularly
so where close relatives marry. For they have not only shared
the same environmental conditions and therefore been subject
to the same damaging influences, but have also derived their
reproductive cells from a common source. The result is that the
damage in the cells of both partners is likely to have occurred
at the same location in each cell, i.e., at the same gene on
the same chromosome. When two such damaged genes are brought
together by the mating of close relatives, the effect of the
damage is tremendously reinforced and the offspring will suffer
doubly from it. And technically, we say the effect is being expressed
homozygously.
It is the discovery of this fact
which has permitted biologists to explore the harmful effect
of mutations by the simple process of
pg.16
of 21
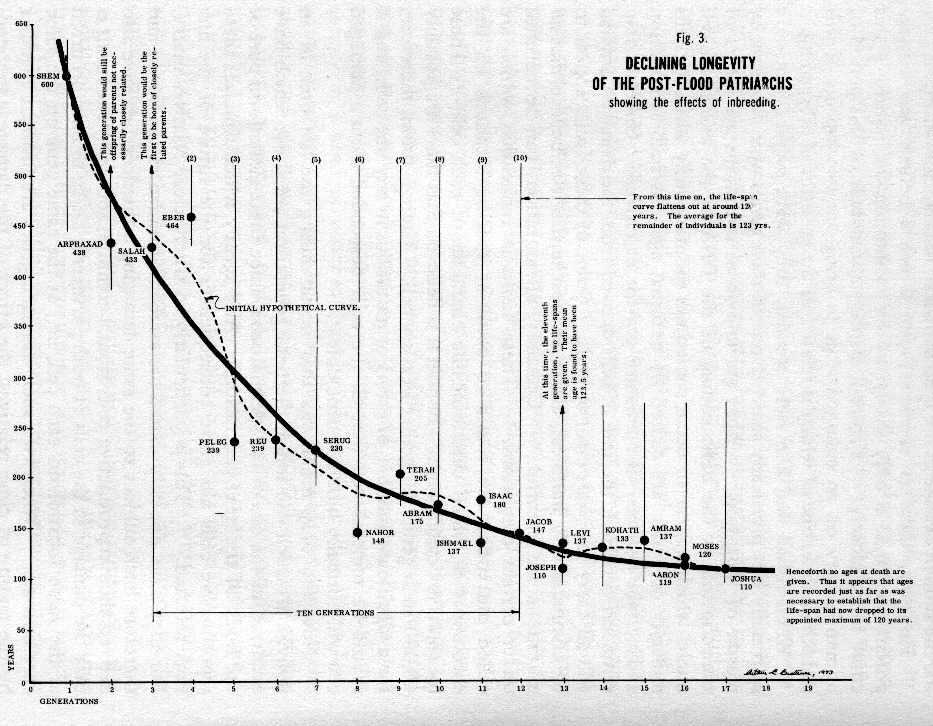 Figure 3. Declining Longevity of the Post-Flood
Patriarchs from Shem to Joshua.
Figure 3. Declining Longevity of the Post-Flood
Patriarchs from Shem to Joshua.
Vertical axis, age in 50-year increments. Horizontal axis, number
of generations.
pg.17
of 21
exaggerating the effects
of inbreeding.
Now what would happen when Adam's
immediate sons and daughters married one another (Genesis 5:4)
is that chromosomes with the same gene content would be paired
off homozygously, but the effects would not be very detrimental
because at this stage in human history the number of damaged
genes would be very small indeed. As time went on and more mutations
began to occur with succeeding generations, partly perhaps because
of the effect of the poison which Adam and Eve had introduced
from the forbidden fruit and had passed on to their descendants,
the danger of such mutations showing up harmfully in children
would increase. However, this increase would be compensated for
by the fact that the population itself was expanding and the
need for brother-sister marriages would become less and less.
More and more distant relations would be mated, and common lines
of damaged genes would be conveyed in their less harmless or
heterozygous form. In view of the great ages to which people
lived, it seems likely that the population would grow more rapidly
than it does at the present time. It is true that people were
slower in maturing but there is no reason to suppose that this
involved any lengthening of the gestation period. It seems
almost certain that families would be larger, and that the population
growth rate would be substantially accelerated.
It seems likely that by the time
of the Flood, the population could have been in the millions,
even though man may not have spread very far from the original
site of the Garden of Eden. In modern times a single city may
easily house a million people. . . . With such numbers
and less than 2000 years of human history, the number of mutations
that would be showing up homozygously in the population need
not have been excessively large and up to that point probably
had no significant effect on the average life span, although
the mortogenic effect of the inherited poison itself brought
every man to the grave in due time (with the exception of Enoch).
But then the situation changed
fundamentally when the population was dramatically reduced to
eight sole survivors, because close inbreeding was once again
forced upon the community. William Hollander, writing on the
effects of lethal mutations in a population has this to say:
(112)
The quickest way to expose lethal
traits is by intensive and continued inbreeding. In man such
matings are generally illegal or taboo; the experience of the
race indicates bad results. But brother-sister matings in animals,
and self-pollination in plants are a standard laboratory practice.
The outcome is generally detrimental unless it has become customary
in the species.
112. Hollander, Willard, "Lethal Heredity",
Scientific American, July, 1952. p.60.
pg.18
of 21
When inbreeding
begins, the heredity seems to be breaking down, all sorts of
defects and weaknesses appear. The average life span decreases
. . . .
But if the family can weather the
first few generations (five with plants, and ten with animals)
a leveling off sets in. Members of the family may show defects
and weaknesses but not new ones, and there is a striking uniformity.
The type has become fixed. [Emphasis mine].
This is essentially
what I believe happened in the case of Noah's family and their
immediate descendants. Moreover, we find that ten generations
were required to normalize the new expected life span. The expected
life span was not, however, the three score years and ten of
David's time (Psalm 90:10) but the 120 years maximum of
Genesis 6:3. Figure 3 is designed to make these observations
more understandable.
The precise meaning of Genesis
6:3 has been a little difficult to establish because the Hebrew
is not absolutely clear. It has been proposed that the words,
"My spirit shall not always strive with man for that he
also is flesh: yet his days shall be 120 years," meant only
that God would restrain his judgment for a period of 120 years
for man to mend his ways while Noah constructed the ark. The
problem is to determine the exact meaning of the Hebrew verb
which lies behind the English words "shall not always strive."
I think the consensus of opinion today is that the intention
of the original text is not that judgment would be delayed for
a period of 120 years, but rather that God would normally call
back to Himself the spirit of each individual before he reaches
120 years of age. In short, this was to be the maximum expected
life span of man hereafter. For example, the Jerusalem Bible
translates Genesis 6:3, "His life shall last no more
than 120 years." By limiting his life span, God intended
to limit his potential for wickedness.
Since God used "natural"
means to effect this limitation, the decline follows a "normal"
curve. The curve of expected life span fell very rapidly at first,
beginning with Arphaxad who lived only 438 years and continuing
through to Jacob who died when he was 147 years of age, ten
generations later. By this time the curve is definitely beginning
to flatten out. For the eleventh generation, we are given two
names, Levi and Joseph, who lived respectively 137 years and
110 years, with an average of 123.5 years. Three generations
later on the chart, with Moses and Aaron, we have reached an
average age of 119.5 years. The final name on the chart is that
of Joshua whose life span had already fallen below 120, as will
be seen.
The extraordinary thing is that
from this time on, we are provided in Scripture with almost no
further data on actual life spans of
pg.19
of 21
individuals � not
even David. *
The figures
given for Job come close, for we are told that "after this,
Job lived 140 years" (Job 42:16), but we are not told
what his age was before this and at the very end we are
merely informed that he died "being old and full of days."
Whether I have failed to observe other exceptional cases where
the age at death is actually given, I do not know. But certainly
I have searched for such cases without success thus far, and
one concludes the silence must be quite intentional. We thus
seem to have in this tabulation clear evidence of an historic
process of degeneration, most of which had occurred by the tenth
generation of those who were born after the Flood . Shem,
of course, has to be excluded from this decade because although
his life was shortened he was born before the Flood, a fact which
suggests that some environmental factors were indeed at work
contributing to the shortening of life.
There is one further point of interest:
from Jacob (the tenth generation) and onwards, the average life
span of the remaining seven individuals whose ages at death are
given was actually 123 years...and it was still obviously declining,
though much more slowly. It is therefore of interest to recall
once again the observation made by Acsadi and Nemeskeri that
the probable maximum life span for man, except under very unusual
circumstances, is now set at 120 years.
Conclusion
It is difficult
to imagine how such data as these, the significance of which
could hardly have been recognized until modern times, could have
been fabricated by some author or authors who wished to add a
supposed dignity to the history of their own patriarchs by giving
them a fictitious longevity in keeping with the claims made by
their contemporaries.
There are ten generations from
Adam to Noah but the phenomenon of reduction in longevity did
not apparently take place. The reasons for this could hardly
have been apparent to people writing centuries later but who
were aware of a drastic reduction in life span in their
own day. They must therefore have been restrained from trying
to doctor the figures to show at least some decline which might
seem to them to make the figures more plausible. That they did
not do so suggests the presence of a restraining Hand as they
wrote. After the Flood, the decline takes a form which has all
the earmarks of truth
* A considerable search in Scripture reveals
only one case, to my knowledge, namely, that of Jehoiada, a priest
(2 Chronicles 24:15), some fourteen centuries later. One wonders
why this sole exception. . . .
pg.20
of 21
about it. The smooth
curve of Fig.3 is not arbitrarily drawn but has been imposed
on the points by strictly mathematical arrangement. Towards the
lower end of the curve several doubles of names appear at significant
points. The tenth generation mark is emphasized, as it were,
by being preceded by the figures for Isaac and Ishmael (ninth
generation) who nicely straddle the normalized curve, and is
followed by the figures for Levi and Joseph (eleventh generation)
who also straddle the normalized curve.
Even the heroic figures
in Israel's history are not accorded the honour of having their
ages at death recorded, the only near exception (as we have mentioned)
being Job, a circumstance which may be intended to enable us
to "place" him in history. He seems likely to have
been a contemporary of Abraham.
It is remarkable, therefore, that
in those far-off days where one might expect to find the least
specific information, there we find the most precise ages carefully
recorded. As soon as later historical times are under review
where exact information would almost certainly be in official
records, the precise statement of age seems to have been deliberately
ignored � even in the case of the Lord Jesus Christ. Certainly
God's ways are not man's ways.
We have now moved back further
and further into the dim and distant past until we find ten patriarchal
giants before the Flood covering with their individual lives
a span of time exceeding that which has elapsed from William
the Conqueror until the present. It is hard to conceive what
this really means in terms of the potential knowledge and experience
that an individual might acquire in such a long lifetime. And
imagine the possibilities for firsthand communication! Adam could
have discussed his experiences with Methuselah over a period
of 243 years, Methuselah could have discussed this information
with Shem for 98 years. And Shem was a contemporary of Abraham
for 150 years.
But what would have happened to
the world's population if natural death had never become part
of human experience? If death had not intruded, an endlessly
growing population was a contingency which God had to take into
account when He created Adam as a potentially immortal creature.
It is worth asking three questions:
(a) what would have happened
if man had not fallen and death had not entered, and if the population
had thus simply gone on increasing century after century;
(b) how did Adam lose that potential or, to
put it slightly differently, how did death come to enter human
experience; and
(c) why was Adam created with such a potential
in the first place if God knew that he would so soon lose it
by his disobedience? Was it not an exercise in futility to endow
him thus to no purpose?

pg.21
of 21
Copyright © 1988 Evelyn White. All rights
reserved
Previous Chapter Next
Chapter
|